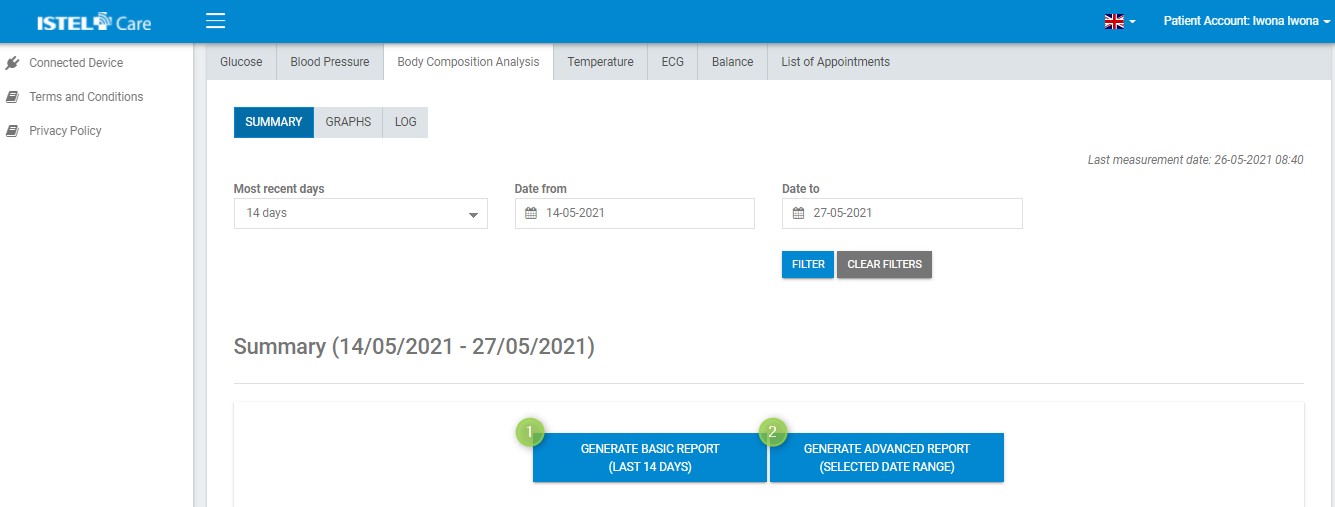
Istel Care allows to generate two types of reports.
Fig. Buttons to generate reports on Body Composition Analysis
BASIC (see 1) – it is generated automatically, always from the most recent 14 days. It contains data from the summary and a line graph.
ADVANCED (see 2) – allows you to select any range of dates, log and graphs to be included in the report.
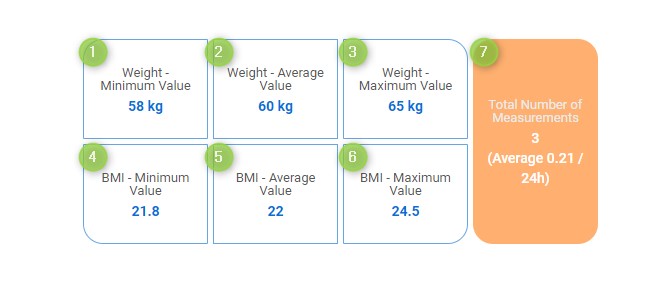
SUMMARY TABLE Information included in the table within the time frame set by the filters:
Weight - minimum value (see 1) – the lowest recorded Patient's Body Weight from all measurements within the selected period.
Body AnalyzerMean Value (see 2) - value of the Patient's Body Weight from all measurements within the selected period.
Body AnalyzerMaximum Value (see 3) - the highest value of the Patient's Body Weight from all measurements within the selected period.
BMI - Minimum Value (see 4) - minimum value of the Patient's BMI from all measurements within the selected period.
BMI - Mean Value (see 5) – mean value of the Patient's BMI from all measurements within the selected period.
BMI - Maximum Value (see 6) - maximum value of the Patient's BMI from all measurements within the selected period.
Total Number of Measurements (see 7) - total number of measurements together with the average number of measurements per day.
BMI (Body Mass Index) is a coefficient derived by dividing the body mass in kilograms by height in metres squared. The index is calculated automatically after entering the Patient’s height and weight.