INSTRUCTIONS
FOR PATIENTS
LINE GRAPH
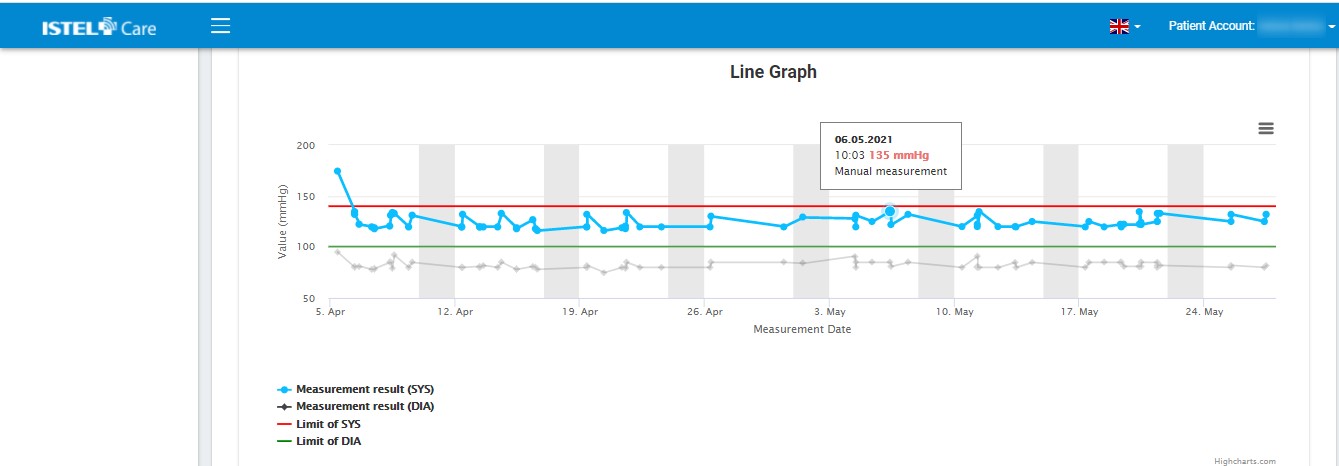
It is a detailed list of test results within a selected time frame:
- Measurement Date
- Measurement Time
- Measurement value with a colour marking indicates if the measurement exceeds the upper limit (normal or above normal)
- Information about the way of entering the measurement (Manual or Measurement from the Device)
Tests performed on Saturdays and Sundays are marked in gray.

The graph has two lines with the results marked as points: for systolic and diastolic pressure and two lines with the upper limits for systolic and diastolic pressure.
- Systolic measurement above the red limit is a high value, while below is normal.
- Diastolic measurement above the green limit is a high value, while below is normal.


