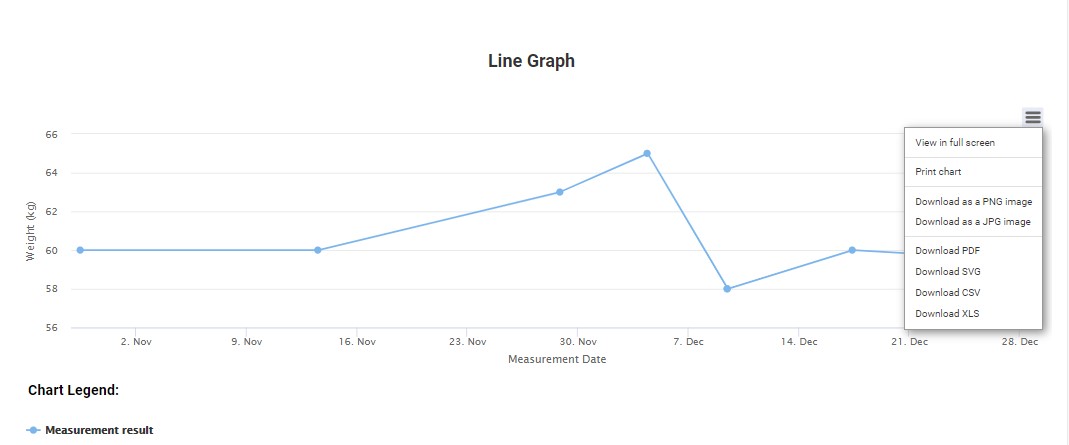
Each graph has an additional menu. After clicking on it, a picklist appears.
Full-screen view
Print graph
Download as a PNG image
Download as a JPG image
Download as PDF
Download as SVG
Download as CSV
Download as XLS
Fig. Additional menu
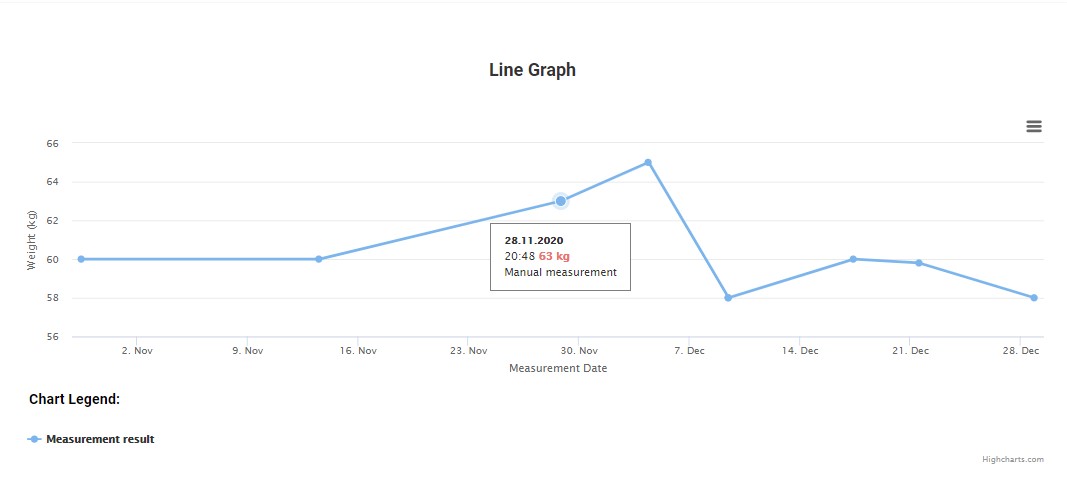
Graphs are interactive and scalable, the units on the axes can be displayed at different distances depending on screen resolutions. It only affects the way the data is displayed.
A single test result is marked as point in the graph. When you move the cursor over the point, a detail window will appear.