Skip to content

INSTRUCTIONS

FOR PATIENTS

PIE CHART

Classification of test results in the analyzed period.

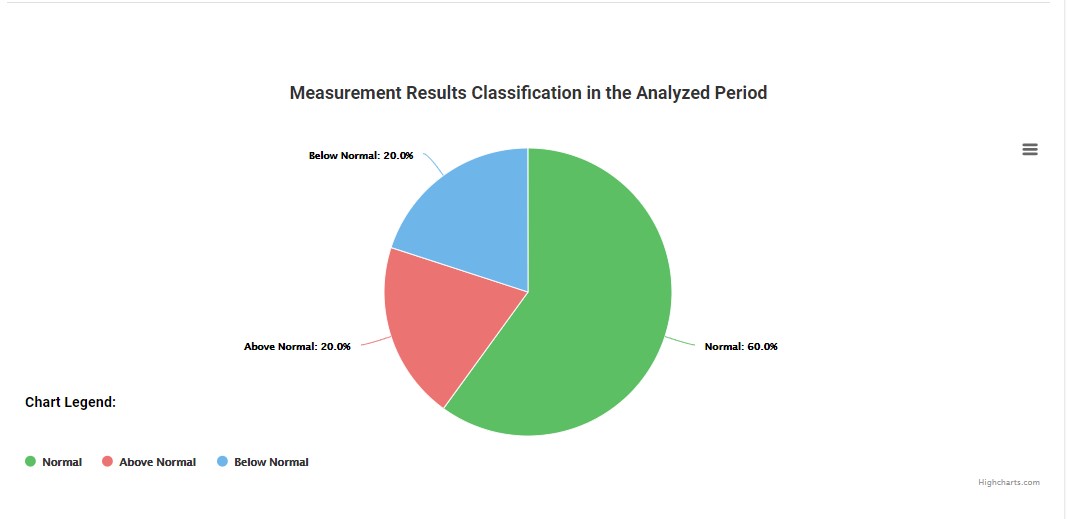
It is a graphical percentage presentation of Normal, Above Normal and Below Normal measurements in relation to all measurements.

Fig. Classification of test results in the analyzed period