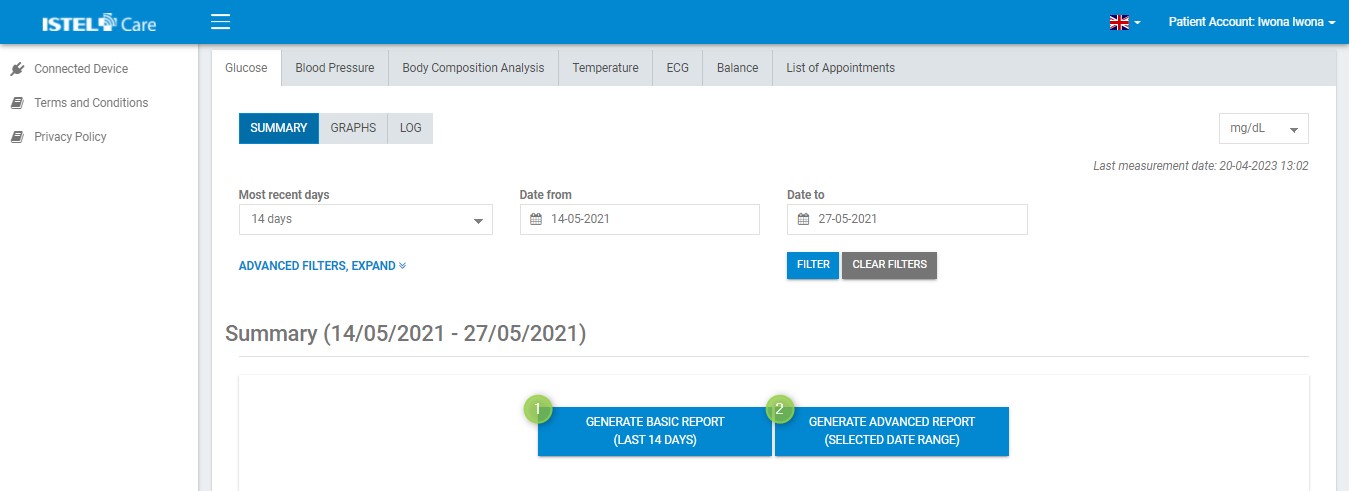
- BASIC (see 1) – it is generated automatically, always from the most recent 14 days. It contains data from the Summary and Ambulatory Glucose Profile (AGP) graph.
- ADVANCED (see 2) – allows to add to the report any range of dates, LOG and type of graphs.
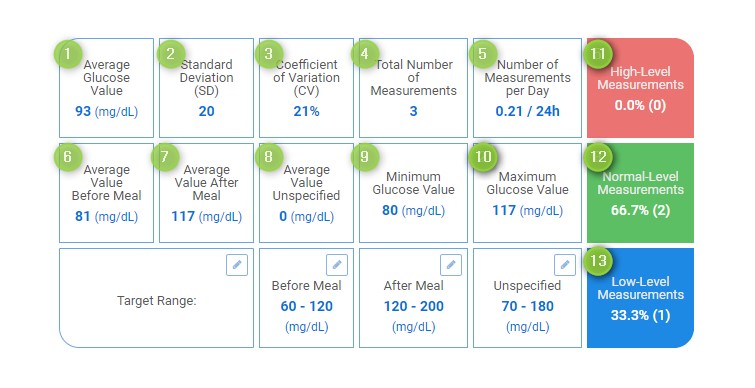
TABLE AND GRAPH WITH MEASUREMENTS SUMMARY
Information included in the table (within the time frame set by the filters):
Average Glucose Value (see 1) – calculated from all Patient’s measurements in a given period.
Standard Deviation (SD) (see 2) – indicates how much Glucose Level results changes. It shows the spread of results around the average of measurements and provides the necessary information on whether the Glucose Level results are similar or different.
Coefficient of Variation (CV) (see 3) – shows the instability of the glycemic results and is calculated from the following formula: SD / average measurement value x 100%, should be CV< 36%.
Total Number of Measurements (see 4) – the total number of measurements within the selected period.
Number of Measurements per Day (see 5) - value calculated from the total number of measurements within the selected period divided by the number of days.
Average Value Before Meal (see 6) – calculated from all of the Patient's measurements within the selected period that are marked as taken before meal.
Average Value After Meal (see 7) – calculated from all of the Patient's measurements within the selected period that are marked as taken after meal.
Average Unmarked Value (see 8) – calculated from all Patient’s measurements in a given period without a meal marking.
Minimum Glucose Value (see 9) – the lowest measured value within the selected period.
Maximum Glucose Value (see 10) – the highest measured value within the selected period.
High-Level Measurements (see 11) – total number of high-level measurements together with their percentage in relation to all measurements within the selected period.
Normal-Level Measurements (see 12) – total number of normal-level measurements together with their percentage in relation to all measurements within the selected period.
Low-Level Measurements (see 13) – total number of low-level measurements together with their percentage in relation to all measurements within the selected period.