Skip to content

INSTRUCTIONS

FOR PATIENTS

SUMMARY

Istel Care allows to generate two types of reports.

Fig. Buttons to generate reports on Blood Pressure
  • BASIC (see 1) – it is generated automatically, always from the most recent 14 days. It contains data from the summary and a line graph.
  • ADVANCED (see 2) – allows to add to the report any range of dates, LOG and type of graphs.

SUMMARY TABLE
Information included in the table (within the time frame set by the filters):

Standard Deviation SD (see 1) – basic measure of variability of the observed results. It indicates how much the pressure results change, i.e. how big is the spread of the results around the average of measurements.

Minimum (see 1) – the lowest values during the selected period .

Maximum (see 3) – the highest measurements values during the selected period - SYS, DIA, BPM, MAP.

Average Value (see 4) – is calculated on the basis of all measurements during the selected period - SYS, DIA, BPM, MAP.

Systolic Pressure SYS (see 5) – upper limit of systolic pressure set individually for each Patient.

Diastolic Pressure DIA (see 6) – upper limit of diastolic pressure set individually for each Patient.

Total Number of Measurements (see 7) – the total number of measurements within the selected period.

Normal-Level Measurements (see 8) – total number of normal-level measurements within the selected period.

High-Level Measurements (see 9) – total number of high-level measurements within the selected period.

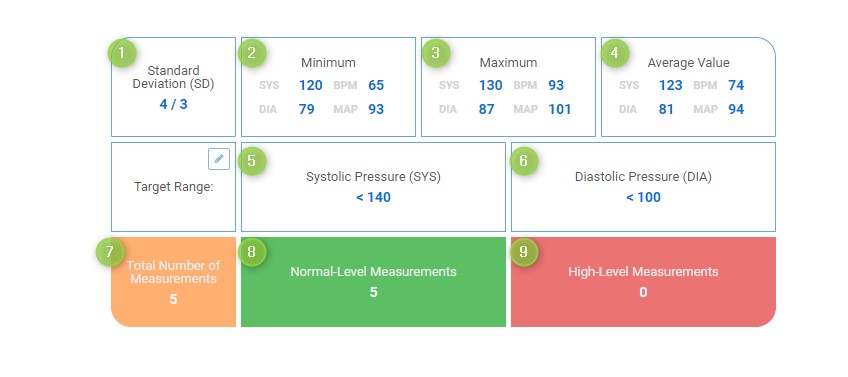
MAP (Mean Arterial Pressure) - means the average Blood Pressure during the cardiac cycle. This is not the arithmetic mean of the systolic and diastolic pressure because the phases of contraction and relaxation are of different duration. The formula for calculating mean arterial pressure is: MAP= (2 * DIA + SYS) / 3

BPM (Beats per Minute) - indicates the number of regular heartbeats per minute.

Fig. Measurements Summary

TARGET RANGE (UPPER PRESSURE LIMITS)

In SUMMARY table, you can set the upper limits for pressure measurements. After clicking on the pencil symbol, the highest value can be set for systolic and diastolic pressure. Determined value is recognized as correct for the Patient.

Fig. Editing Target Range
Fig. Editing Measurement Limits

The test result on the graph is displayed in the colour that corresponds to the set target ranges: Red means a High Value, Green - Normal and Blue - Low.