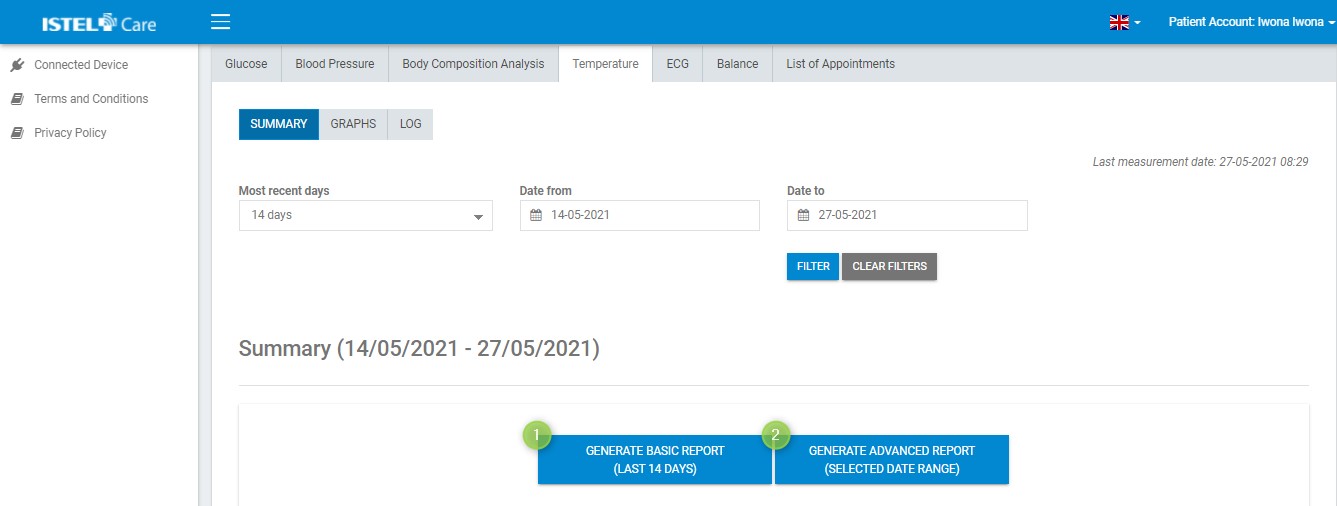
Istel Care allows to generate two types of reports.
Fig. Buttons to generate reports on Temperature
BASIC (see 1) – it is generated automatically, always from the most recent 14 days. It contains data from the summary and a line graph.
ADVANCED (see 2) – allows to add to the report any range of dates, LOG and type of graphs.
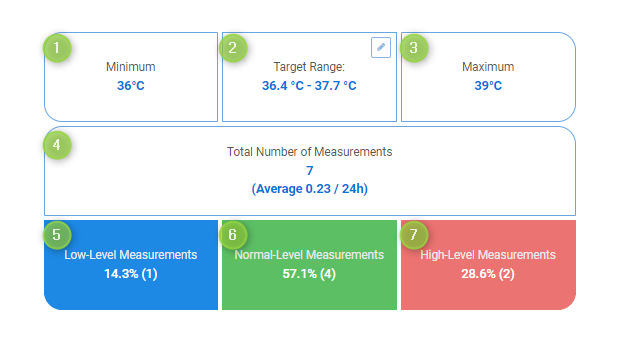
SUMMARY TABLE Information included in the table (within the time frame set by the filters):
Minimum – the lowest values during the selected period (see 1).
Target Range – optimal weight range for a Patient (see 2).
Maximum - the highest values during the selected period (see 3).
Total Number of Measurements - total number of measurements within the selected period (see 4).
Low-Level Measurements - total number of low-level measurements within the selected period (see 5).
Normal-Level Measurements - total number of normal-level measurements within the selected period (see 6).
High-Level Measurements - total number of high-level measurements within the selected period (see 7).
Fig. Summary of temperature measurements
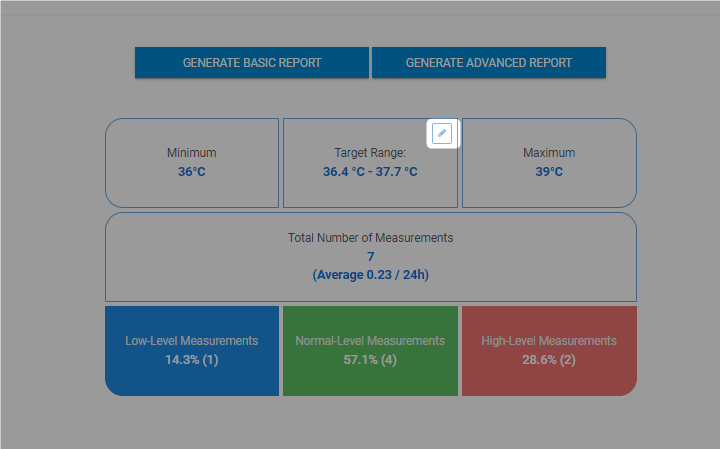
Target Ranges
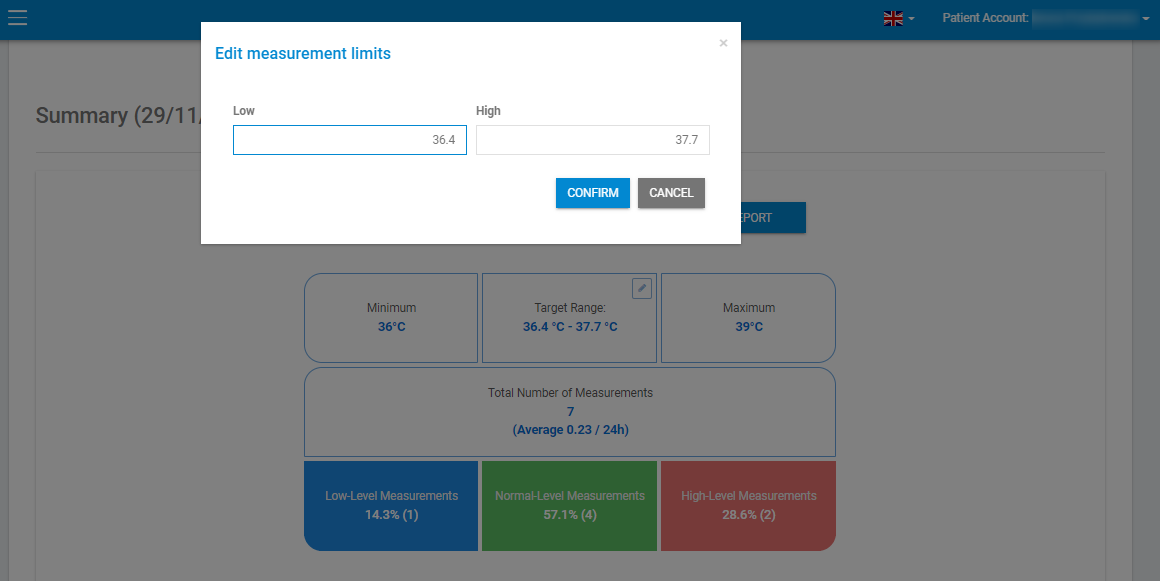
In the SUMMARY table, you can edit the target ranges. After clicking on the pencil symbol, the lower and upper limits for Temperature measurements can be set.
Fig. Editing target range
Fig. Editing measurement limits
The test result on the graph is displayed in the colour that corresponds to the set target ranges: Red means a High Value, Green - Normal and Blue - Low.