This graph allows to analyse the variability of Blood Pressure levels in specific time. Thanks to that you can see daily, weekly and monthly patterns characteristic for the Patient.
Range types:
DAILY - compares separate days, hour to hour; measurements are displayed from 0:00 to 23:59 on a given day.
WEEKLY - compares selected weeks with each other; 7 days, from Monday to Sunday.
MONTHLY – compares results from the first to the last day of the month; for months of different lengths, the last days of longer months will have no reference points to shorter months.
The overlapping graph has an own filter, which means that filters and advanced filters do not affect it.
To display data in the appropriate time ranges:
Rozwiń listę wyboru oznaczoną jako “Typ zakresu”
Select the daily, weekly or monthly range.
Kliknij w przycisk “Wybierz zakres” i ustal daty
Data will automatically appear on the graph.
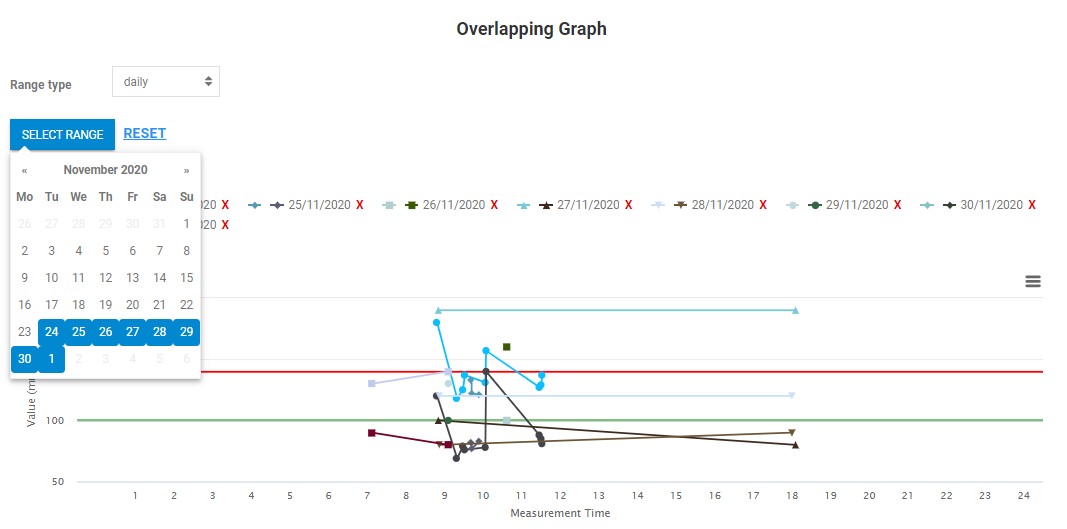
Fig. Range settings on the daily chart
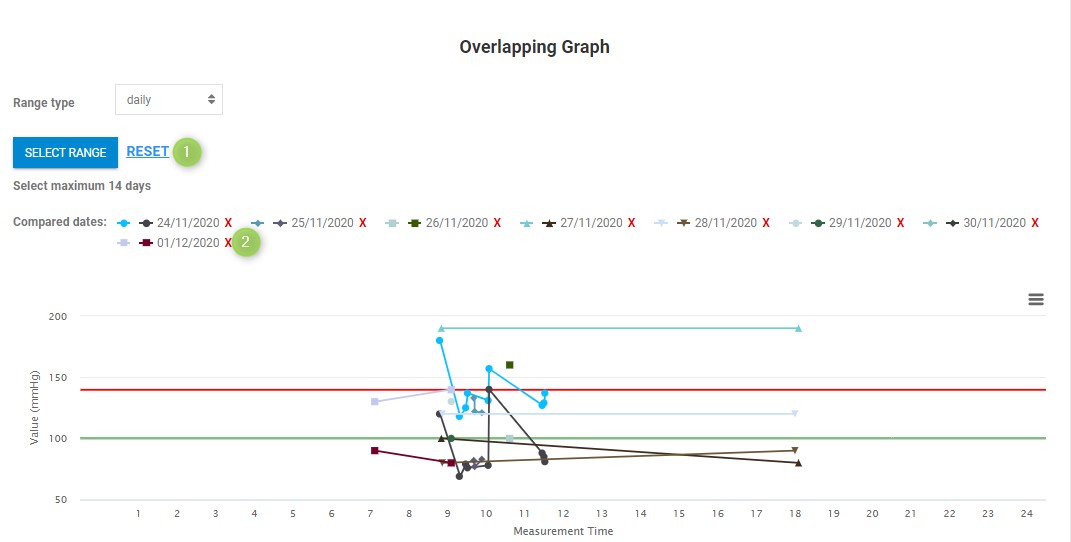
To delete one of the selected ranges, click on the red cross (see 2) or delete all of them by clicking on the RESET button (see 1).