INSTRUCTIONS
FOR DOCTORS
LINE GRAPH
It is a detailed list of test results within a selected time frame:
- Measurement Date
- Measurement Time
- Measurement value with a colour marking indicates if the measurement exceeds the upper limit (normal or above normal)
- Information about the way of entering the measurement (Manual or Measurement from the Device)
Tests performed on Saturdays and Sundays are marked in gray.
![](https://istelcare.pl/wp-content/uploads/2020/12/7e.jpg)
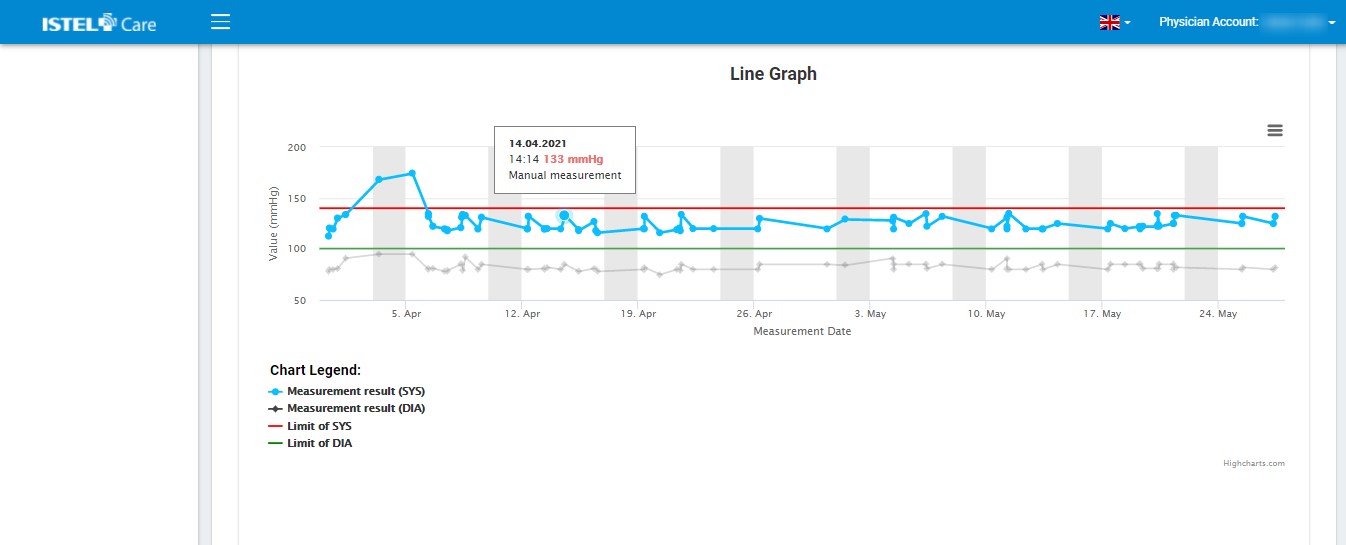
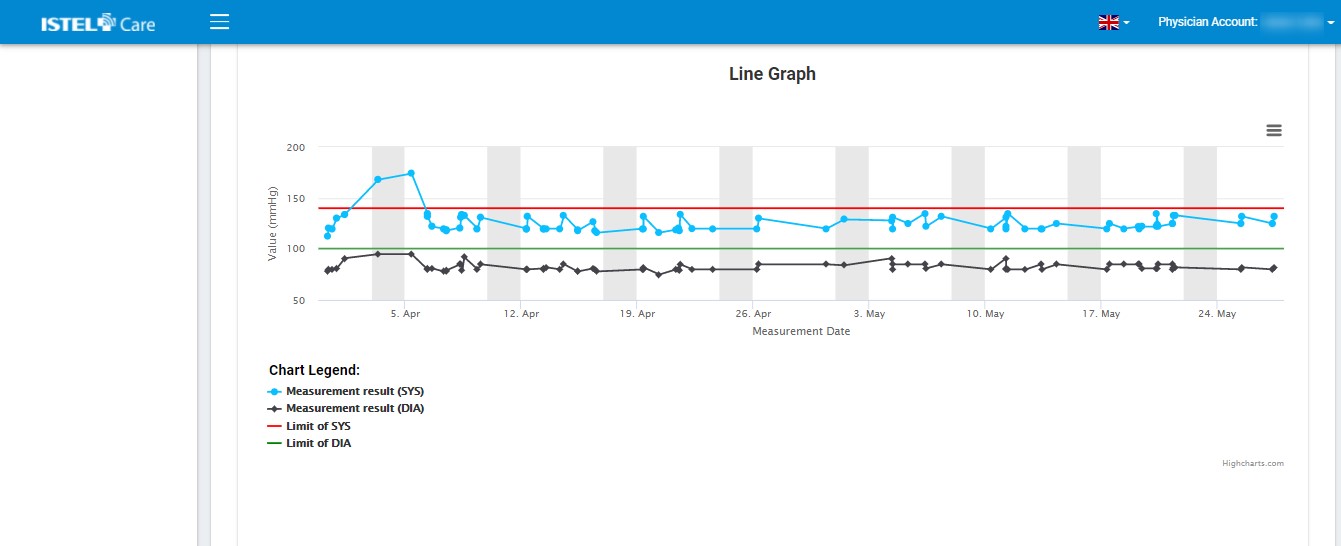
The graph has two lines with the results marked as points: for systolic and diastolic pressure and two lines with the upper limits for systolic and diastolic pressure.
- Systolic measurement above the red limit is a high value, while below is normal.
- Diastolic measurement above the green limit is a high value, while below is normal.
![](https://istelcare.pl/wp-content/uploads/2020/12/8e.jpg)