Skip to content
About
Instructions
For Doctors
For Patients
Quick instruction
Apps
Devices
For Doctors
For Patients
Sign In
Doctor
Staff
Patient
Demo
Create an account
Menu
About
Instructions
For Doctors
For Patients
Quick instruction
Apps
Devices
For Doctors
For Patients
Sign In
Doctor
Staff
Patient
Demo
Create an account
PL
About
Instructions
For Doctors
For Patients
Quick instruction
Apps
Devices
For Doctors
For Patients
Sign In
Doctor
Staff
Patient
Demo
Create an account
Menu
About
Instructions
For Doctors
For Patients
Quick instruction
Apps
Devices
For Doctors
For Patients
Sign In
Doctor
Staff
Patient
Demo
Create an account
Sign In
Doctor
Staff
Patient
Demo
Create an account
Sign In
Doctor
Staff
Patient
Demo
Create an account
PL
INSTRUCTIONS
FOR
DOCTORS
ABOUT ISTEL CARE
TERMINOLOGY
COMPATIBLE DEVICES
MAIN PAGE
CREATING AN ACCOUNT AND ACCESS TO THE PANEL
LOG IN
REMIND PASSWORD
ACCOUNT SETTINGS
ACCOUNT UPGRADE
PATIENT REGISTRATION BY THE DOCTOR AND MEDICAL STAFF
PATIENTS
NOTIFICATIONS
Patients Chart
GLUCOSE LEVEL
SUMMARY
Graphs
AMBULATORY GLUCOSE PROFILE
LINE GRAPH
PIE CHART
GRAPH OF DEVIATIONS
Log
ADDING A MEASUREMENT MANUALLY
DELETING A MEASUREMENT
BLOOD PRESSURE
SUMMARY
Graphs
LINE GRAPH
GRAPH OF DEVIATIONS
PIE CHART
OVERLAPPING GRAPH
Log
ADDING A MEASUREMENT MANUALLY
DELETING A MEASUREMENT
Body composition analysis
SUMMARY
Graphs
LINE GRAPH
OVERLAPPING GRAPH
Log
ADDING A MEASUREMENT MANUALLY
DELETING A MEASUREMENT
TEMPERATURE
SUMMARY
Graphs
LINE GRAPH
PIE CHART
OVERLAPPING GRAPH
Log
ADDING A MEASUREMENT MANUALLY
DELETING A MEASUREMENT
ECG
BALANCE
LIST OF APPOINTMENTS
APPOINTMENTS
OPENING AN APPOINTMENT
CREATING A TELECONFERENCE
MOVING TO AN OPENED APPOINTMENT
ENDING AN APPOINTMENT
EDITING AN APPOINTMENT
PATIENT ALERTS
CONNECTED DEVICE
GLUCOSE METERS
CONNECTING THE METER
ASSIGNING THE METER TO A PATIENT
ASSIGNING THE METER TO A PATIENT WHO HAS NOT GIVEN ACCESS TO THEIR PATIENT CHART YET
ASSIGNING THE METER TO ANOTHER PATIENT
SAVING MEASUREMENTS TO THE PATIENT CHART
DISPLAY DATA IN GUEST MODE
CONFIGURATION OF THE GLUCOSE METER
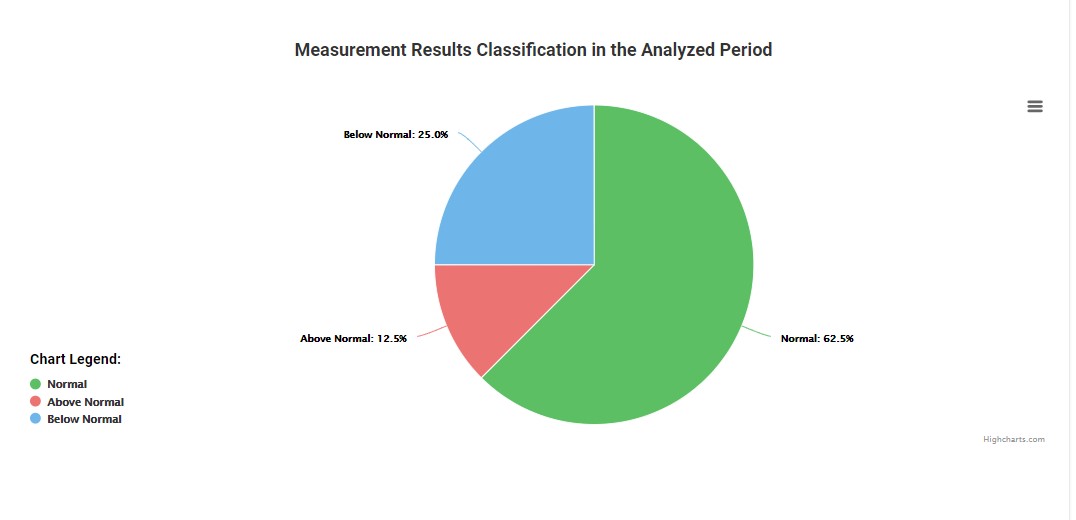
PIE CHART
It is a graphical presentation of the percentage of normal, above normal and below normal measurements in relation to all measurements.
Fig. Classification of test results in the analyzed period