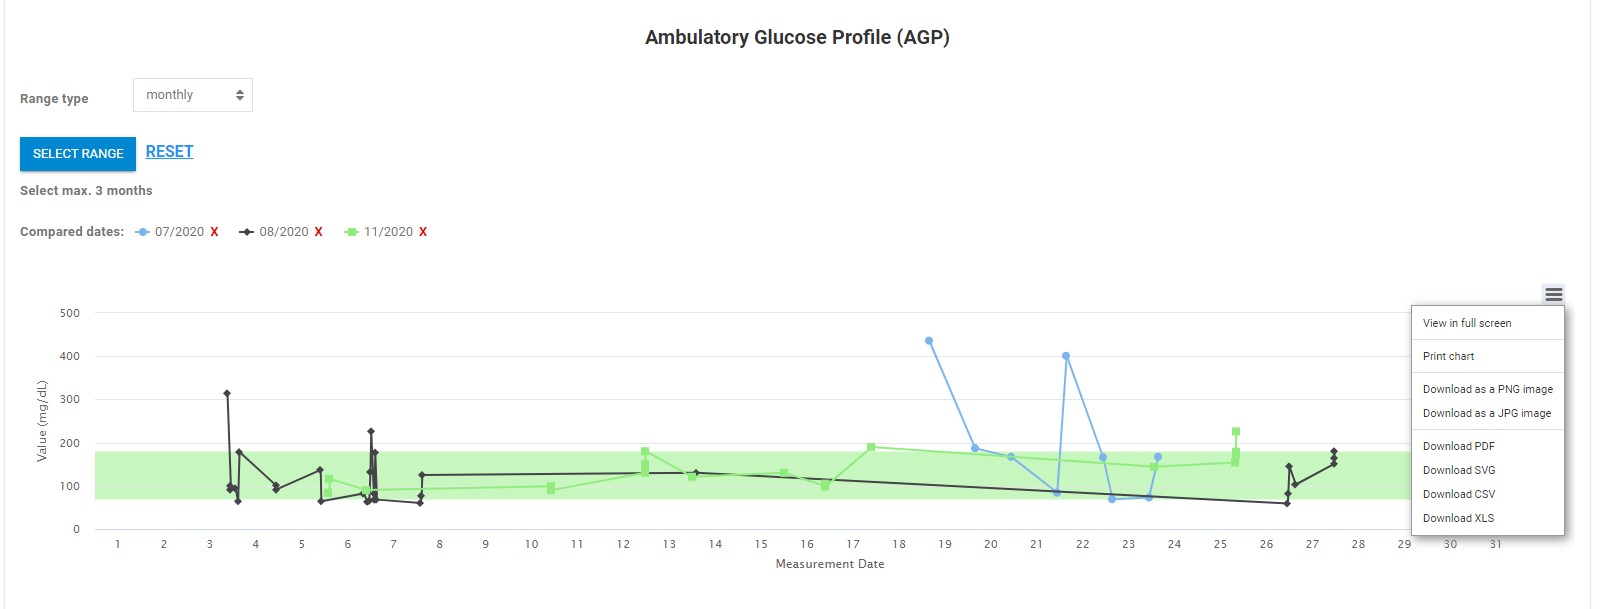
Each graph has an additional menu. After clicking on it, a picklist appears.
Full-screen view
Print graph
Download as a PNG image
Download as a JPG image
Download as PDF
Download as SVG
Download as CSV
Download as XLS
Fig. Additional menu
You can delete only the measurements that are entered into the Istel Care System manually. It is not possible to delete measurements transmitted from the device.
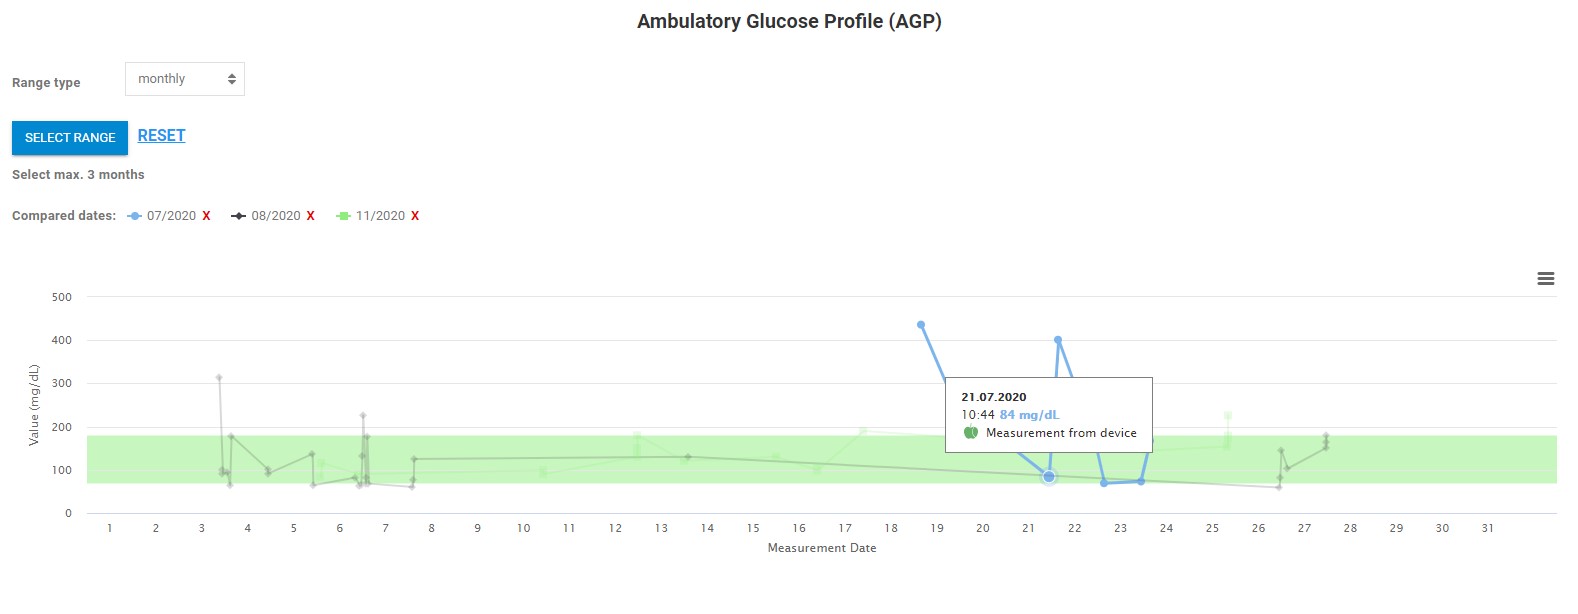
A single test result is marked as point in the graph. When you move the cursor over the point, a detail window will appear.
Fig. Detailed line graph
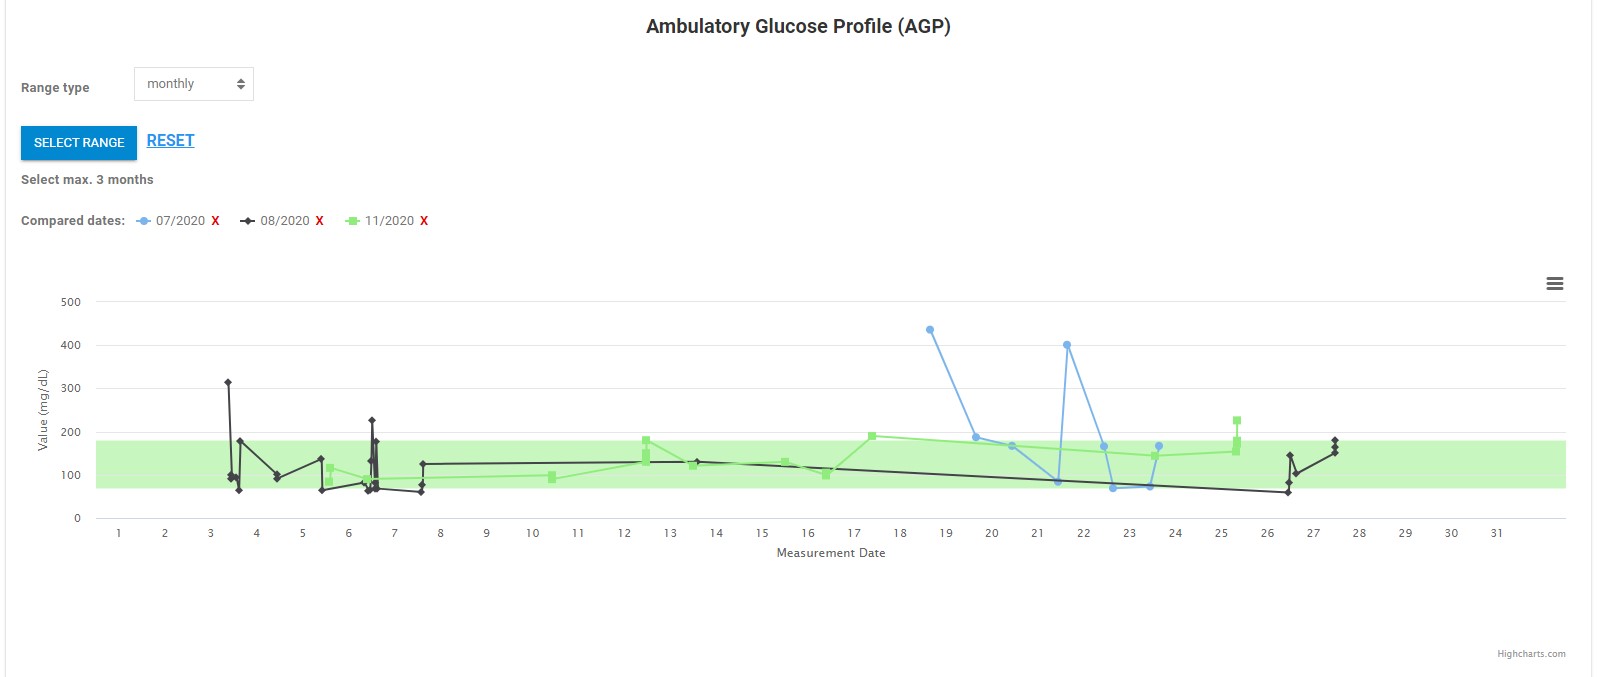
Measurements within the Normal Range are those in the Green field. Measurements above the green field are classified as High, and those below as Low.