Istel Care allows to generate two types of reports.
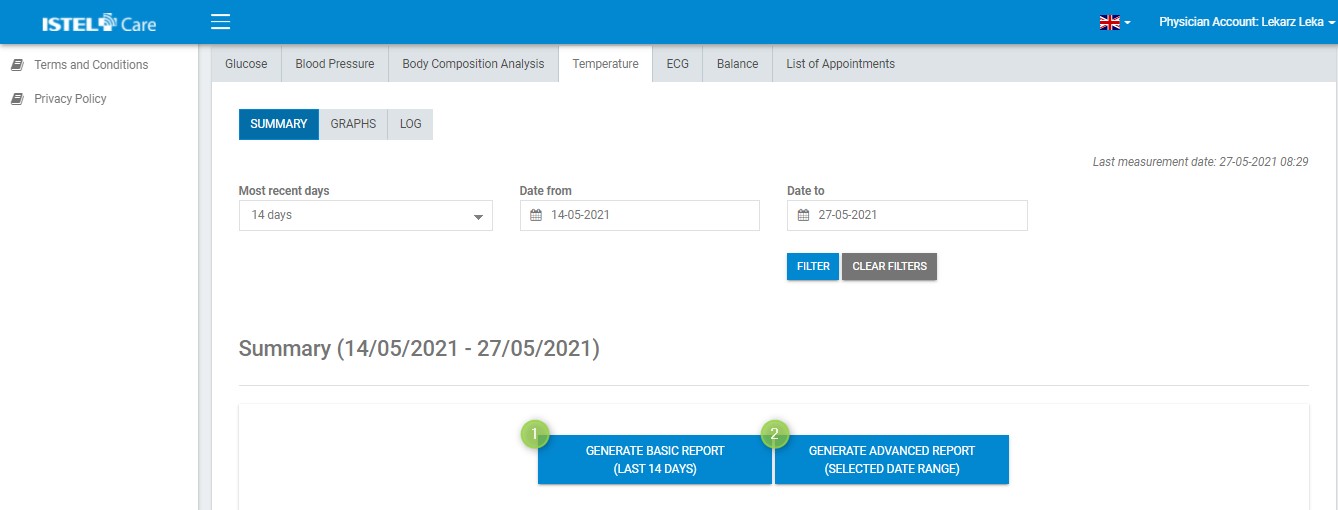
Fig. Buttons to generate reports on Temperature
BASIC (see 1) – it is generated automatically, always from the most recent 14 days. It contains data from the summary and a line graph.
ADVANCED (see 2) – allows to add to the report any range of dates, LOG and type of graphs.
SUMMARY TABLE
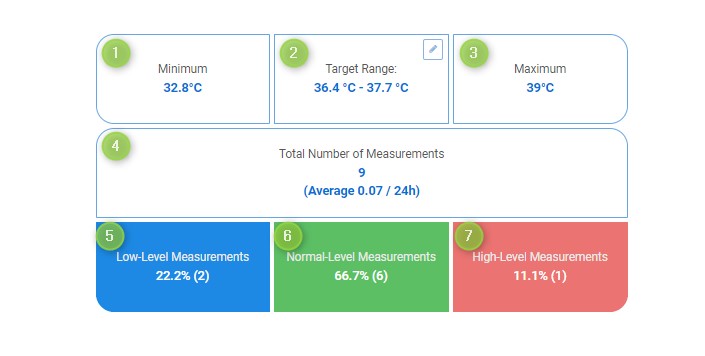
Information included in the table (within the time frame set by the filters):
Minimum – the lowest values during the selected period (see 1).
Target Range – optimal weight range for a Patient (see 2).
Maximum - the highest values during the selected period (see 3).
Total Number of Measurements - total number of measurements within the selected period (see 4).
Low-Level Measurements - total number of low-level measurements within the selected period (see 5).
Normal-Level Measurements - total number of normal-level measurements within the selected period (see 6).
High-Level Measurements - total number of high-level measurements within the selected period (see 7).
Fig. Table with a summary of measurements
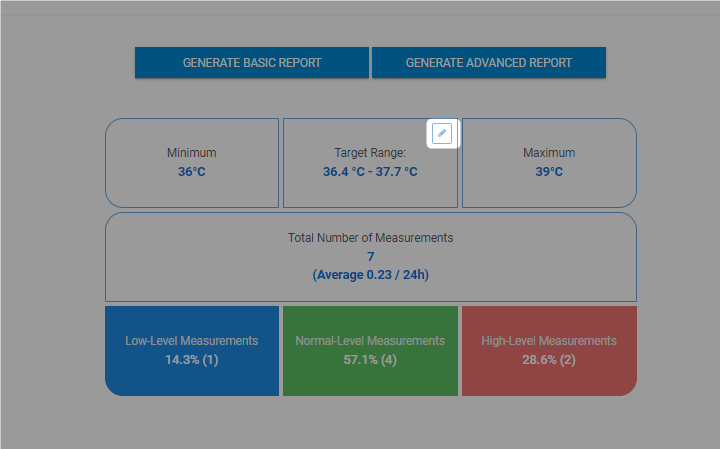
TARGET RANGES
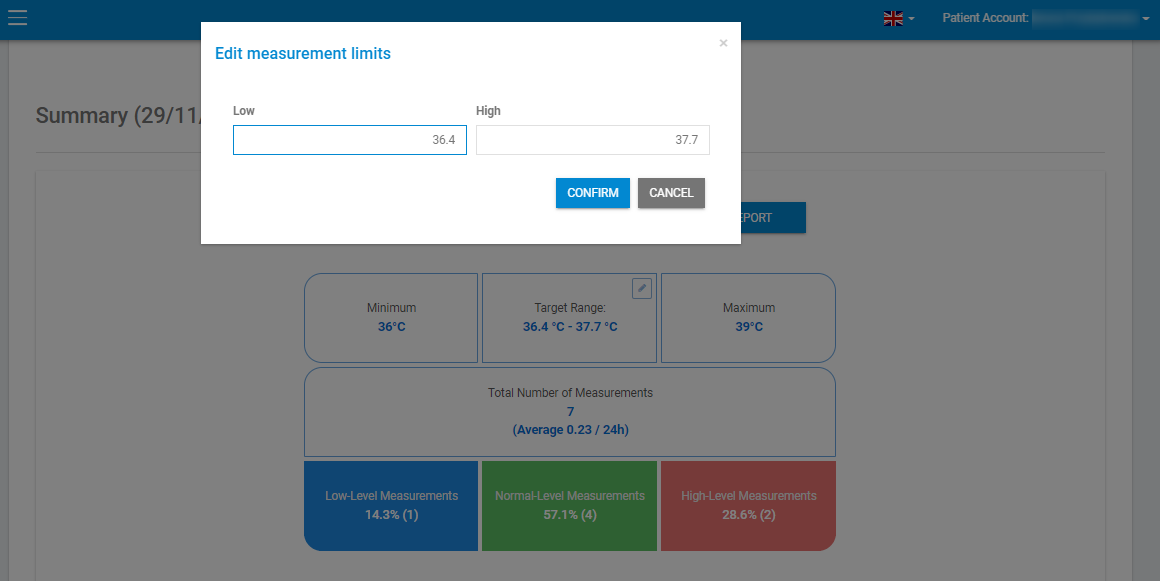
W tabeli “Podsumowanie” istnieje możliwość edycji zakresów docelowych. Po kliknięciu w symbol ołówka ustala się limit dolny i górny dla pomiarów temperatury.
Fig. Activating target range editing
Fig. Editing measurement limits
In the graphs, the measurements displayed are marked in colour, where red means a high value, green - normal and blue - low.