PL
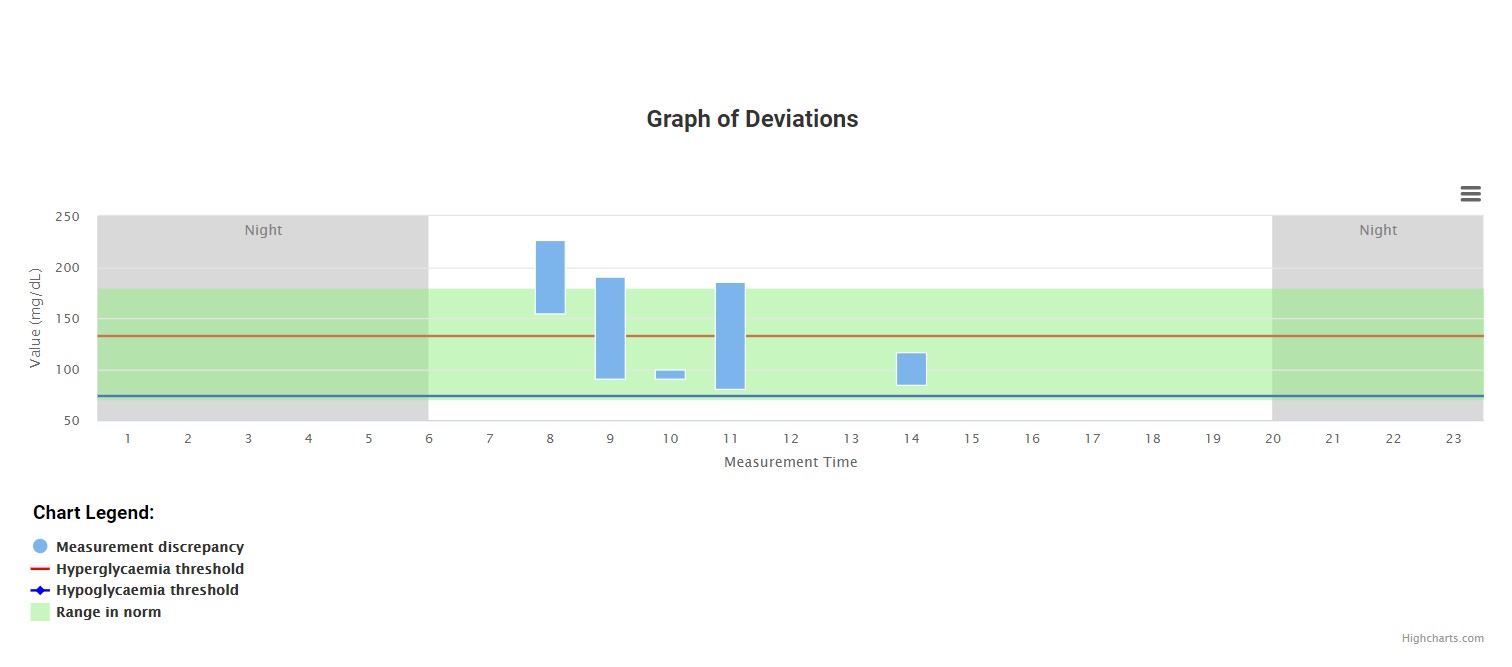
The graph shows how much the Blood Pressure results change during the day, i.e. the spread of the results around the average of measurements during the specified hourly intervals.