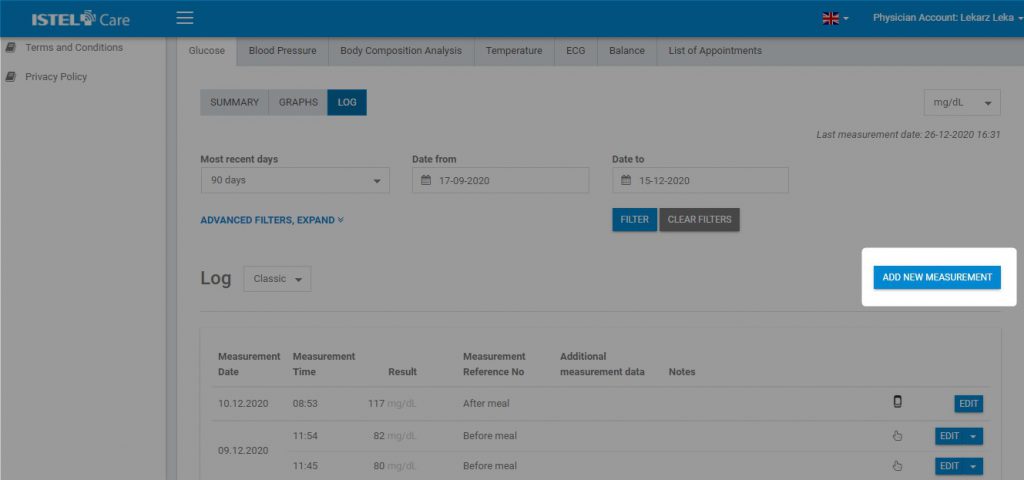
To add a measurement manually, click on the ADD NEW MEASUREMENT button.
Fig. Add a new measurement button
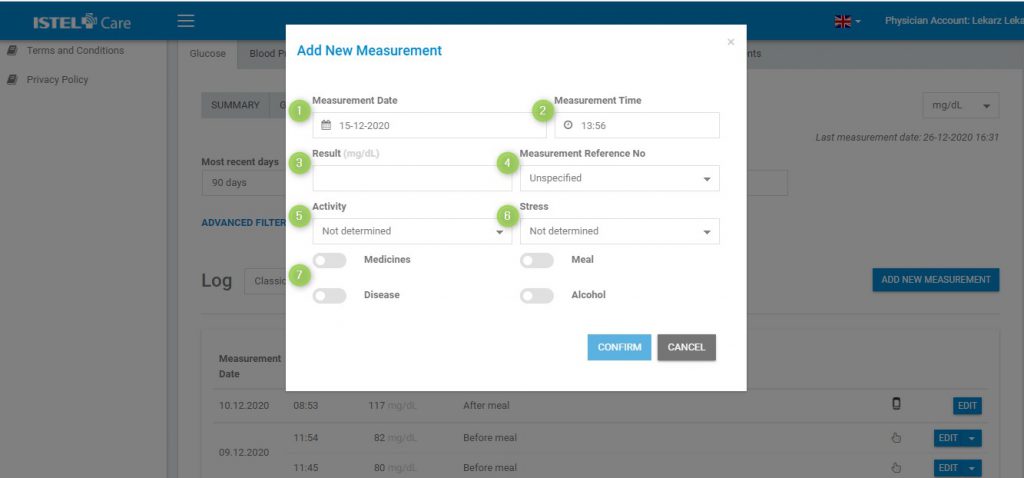
When you click on it, a form will appear where you can enter the data:
Measurement Date (see 1) Measurement Time (see 2) Result (see 3) Marking a Measurement (see 4) - Before Meal, After Meal or Unmarked Activity (see 5) - High, Moderate, Low or Not Determined Stress (see 6) - High, Moderate, Low or Not Determined Additional Markers (see 7): Medicines, Meal, Disease (adding notes is possible), Alcohol
Fig. Form for adding a new measurement manually
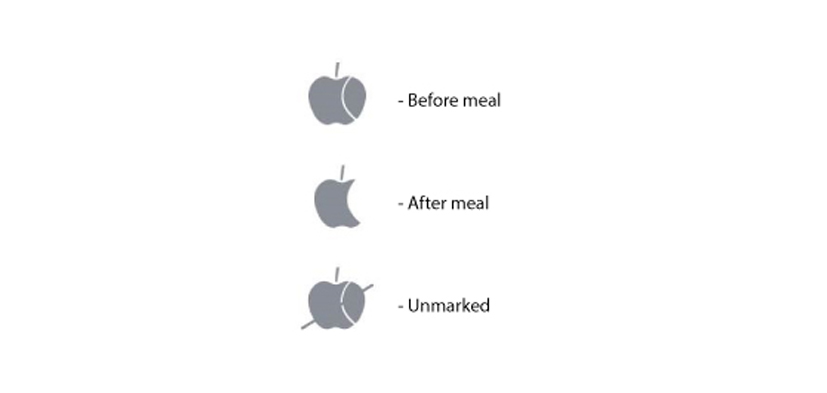
Measurement marking in the context of meals is presented in graphs and in the log in graphical form.
Fig. Measurement marking in the context of meals
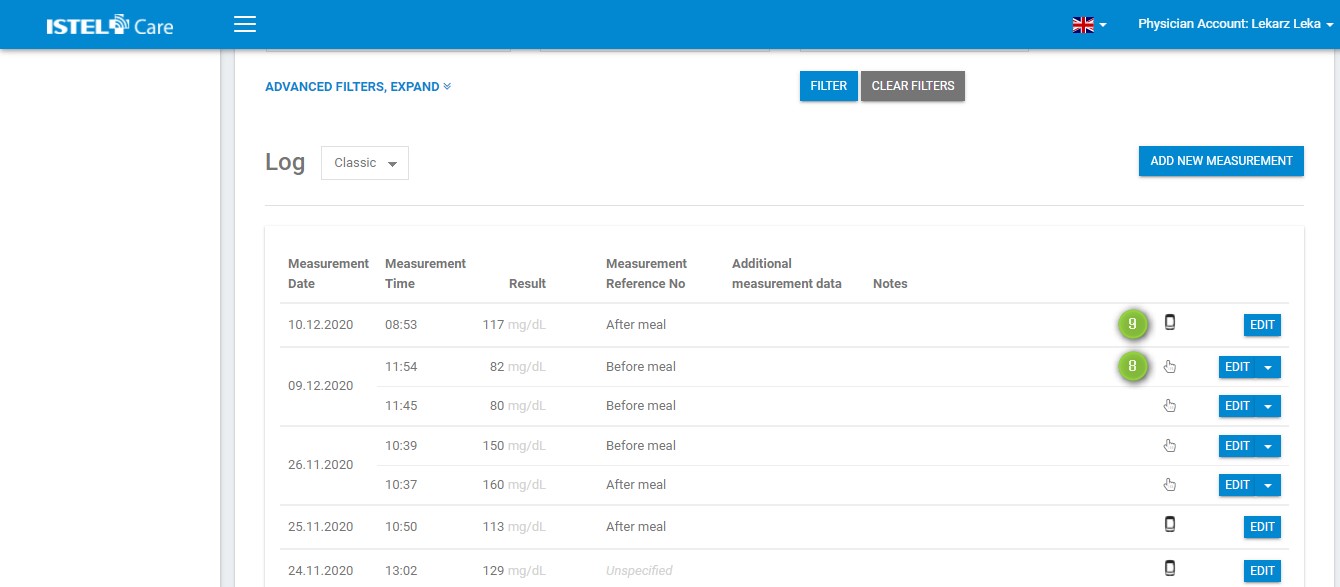
Colour markings of measurements in the Log and on Graphs:
High-Level Measurements (Above Normal)– red colour
Normal-Level Measurements (Normal) – green colour
Low-Level Measurements (Below Normal) – blue colour
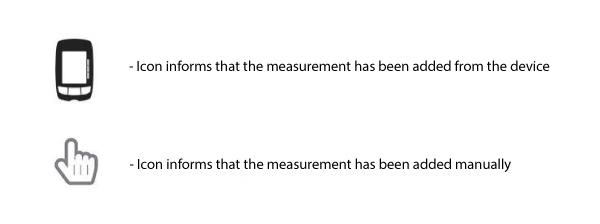
In the Classic Log, manually added measurements are marked with the "hand" icon (see 8), while measurements added from the device have the "meter" icon (see 9).
Fig. Measurements added manually and from the device
Fig. Marking of the way the measurement is entered into the system